
Anatomy of the Peritoneum
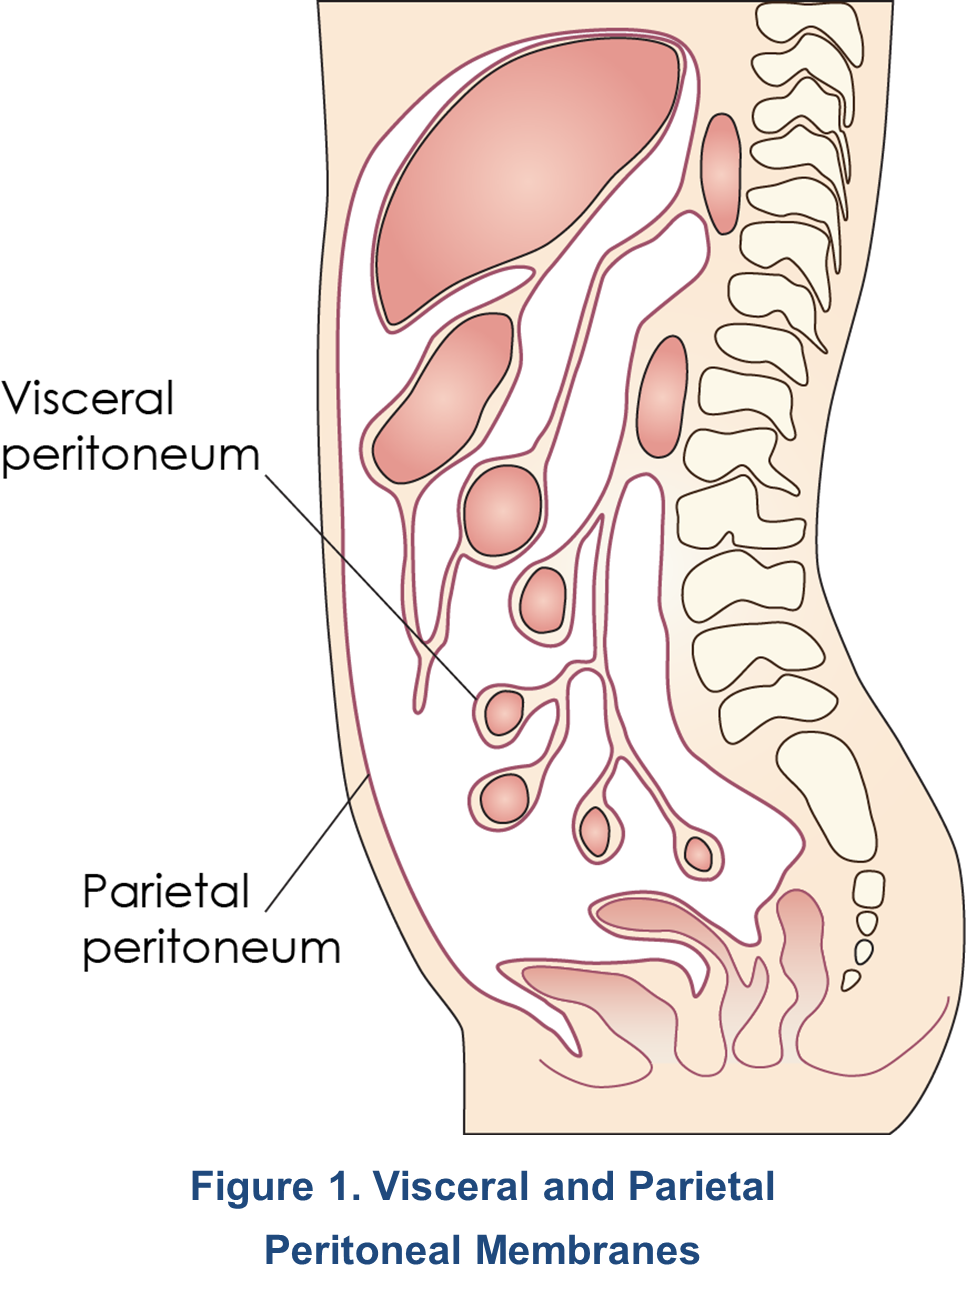 The peritoneum consists of the parietal peritoneum – a heterogeneous, serous, semi-permeable membrane that lines the abdominal wall – and the visceral peritoneum, which covers the abdominal organs (Figure 1)1. Its surface area is approximately 1-2 m2. In males, the peritoneum is a closed-sac system, whereas in females it is an open-sac system with the fallopian tubes and ovaries connecting to the peritoneal cavity. The parietal peritoneum derives its blood supply from the abdominal wall (lumbar, intercostals, and epigastric regions) and drains into the inferior vena cava, while the visceral peritoneum receives its blood supply from the superior mesenteric artery and drains into the portal vein. The total peritoneal blood flow ranges from 50–150 mL/min2. The peritoneal cavity, located between the parietal and visceral peritoneum2, contains approximately 100 mL of serous fluid1 and becomes the dialysate compartment during peritoneal dialysis (PD) from which exchange of solutes with the blood can occur1,3. Drainage of the peritoneal cavity is mainly accomplished by the lymphatic system. Importantly, the subdiaphragmatic lymphatic system is responsible for 70-80% of the lymphatic flow from the peritoneal cavity. The lymphatic system also serves as a pathway for the removal of foreign substances and macromolecules. In stable patients undergoing PD, the rate of lymphatic flow varies from 7-20 mL/hr with total fluid losses between 60-91 mL/hr4.
Six Layers of the Peritoneum
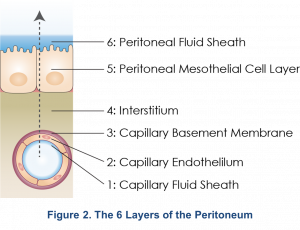
The peritoneal membrane is comprised of six layers consisting of the capillary fluid sheath, capillary endothelium, endothelial basement membrane, interstitium, mesothelium, and the peritoneal fluid sheath (Figure 2)1. It was previously thought that all six layers provided different levels of resistance to solutes, and the mesothelial layer with its large surface area functioned as the dialyzer. However, the three-pore model (discussed below) suggests that the peritoneal capillary is the critical barrier to peritoneal transport5.
The Three-Pore Model
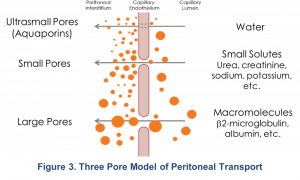
The three-pore model (TPM) of the peritoneum defines solute and water transport across the peritoneal capillary through pores of three different sizes: Large, small, and ultra-small pores5. This model has been validated by clinical observations6,7. The large pores range from 10-20 nm (100-250 A°) in size and are formed by clefts between endothelial cells. Large pores are small in numbers, < 0.01% of total pores, and account for < 10% of solute removal (macromolecules). Small pores are more numerous, also formed by clefts between endothelial cells, account for > 90% of solute removal (small solutes) and water, and range from 4-6 nm in diameter. Ultra-small pores, comprised mainly of Aquaporin-1, range in size from 0.4-0.6 nm and are transcellular channels in the endothelial cells that transport water only and provide 0% of solute removal5. The transport of water via Aquaporin-1 is also known as “free-water transport” and contributes to ~50% of the ultrafiltration in PD5.
Although this model suggests that the interstitium may also contribute to resistance to solute transport, there is no resistance from the mesothelium itself or from stagnant fluid layers5. Additional research has expanded on this model. Ronco proposed that the peritoneal vasculature, particularly the surface area of the peritoneal capillaries, rather than the entire surface area of the peritoneum and the interstitium, is responsible for facilitating solute transport5,8. Specifically, the distance of each peritoneal capillary from the mesothelium determines that capillary’s relative contribution to effective surface area and the resistance properties of the membrane. This concept is called the “nearest capillary hypothesis”, where the capillaries closer to the mesothelium experience a greater osmotic effect compared to those farther away8. Since patients with the same total peritoneal surface area may have very different degrees of peritoneal vascularity, their effective peritoneal surface areas would also vary widely. Moreover, in a single patient, peritoneal surface area may be altered by specific events such as episodes of peritonitis9.
Physiology of Peritoneal Transport
Mechanisms of Transport
Peritoneal transport of solutes and water depends on four simultaneously occurring mechanisms: diffusion, osmosis, convection and fluid absorption1,10.
Electrolyte and Solute Transport
Diffusion
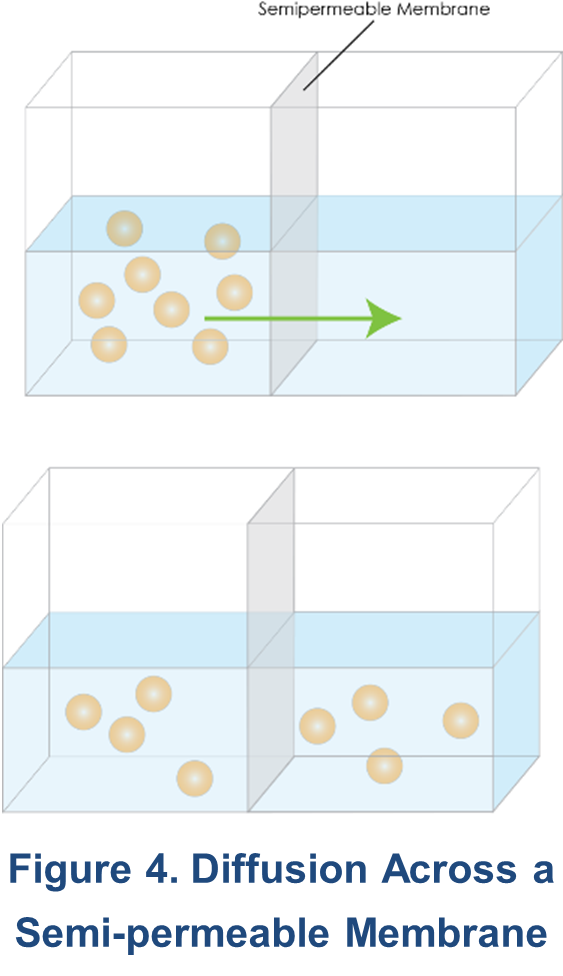 The process of diffusion results in the net movement of solute molecules from an area where they are in high concentration to an area where their concentration is low, across a semipermeable membrane (Figure 4). Although solute moves randomly in both directions, there is more solute moving from a high to a low concentration than in the opposite direction. Eventually, the concentrations become equal on both sides of the membrane, and the net movement in each direction is zero. An important concept is that the movement of solute molecules is random and driven by thermal energy. This thermal energy is transformed to kinetic energy, which is the product of mass and velocity. Since this energy is the same for different sized molecules at the same temperature, larger molecules tend to move slower than smaller ones11. In addition to the concentration gradient, peritoneal diffusion depends on the peritoneal surface area available for transport, the intrinsic resistance of the membrane, and the molecular weight of the solute to be transported10.
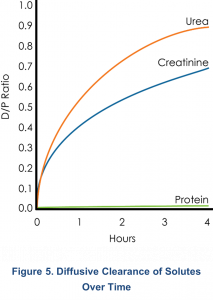 Diffusion is, by far, the most important process involved in the transport of electrolytes and solutes in peritoneal dialysis (PD). Examples of such solutes include: urea, creatinine, potassium (K+), hydrogen (H+), bicarbonate (HCO3–), phosphate, albumin, proteins and uremic toxins3,7. Diffusive transport of sodium (Na+) and calcium (Ca2+) is minimal10.
Diffusive flux is highest in the first hour and decreases over time. For instance, as shown in Figure 5, urea is > 90% equilibrated by 4 hours, and creatinine is > 60% equilibrated. Further small solute transport is minimal, and long dwells are more important for the removal of the larger molecular weight (MW) solutes such as β-2 microglobulin and other proteins9.
Convection
In convective transport, the solvent (i.e. water) carries dissolved solutes through all of the membrane pores except the Aquaporins-1. This is more pronounced if higher concentrations of osmotic agents are used in the dialysate1.
Water Transport
Osmosis and Ultrafiltration
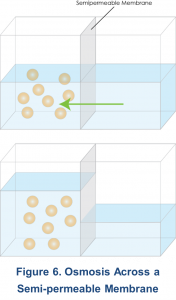
Osmosis can be defined as the movement of a solvent (i.e., water) from an area of low solute concentration to an area of higher solute concentration across a semi-permeable membrane11. In peritoneal transport, water movement occurs equally via the small pores and Aquaporins-1, as described by the three-pore model5.
 Ultrafiltration (UF) is the process that occurs as a result of the osmotic gradient (i.e., osmotic pressure) created between the relatively hypertonic dialysis solution and the relatively hypotonic peritoneal capillary blood. With the use of hypertonic dialysis solutions, ultrafiltration can lead to fluid removal and convective removal of solutes, especially medium-sized molecules. However, the effectiveness of ultrafiltration can be affected by various factors. These include the hydraulic conductance of the peritoneal membrane, the reflection coefficient for the osmotic agent, the osmotic agent used, osmotic concentration and gradient, the effective peritoneal surface area, the dwell time, and the hydrostatic pressure gradient, which are discussed in more detail below.
- Hydraulic conductance of the peritoneal membrane3: Reflects the density of small pores and ultra-small pores in the peritoneal capillaries, and the distribution of distances of capillaries from the mesothelium. This differs between patients.
- Reflection coefficient for the osmotic agent3: Ranging from 0 and 1, the reflection coefficient reflects the osmotic agent’s effectiveness to diffuse out of the dialysis solution into the peritoneal capillaries. Lower values indicate that the osmotic agent will diffuse out of the dialysis solution into the patient’s body at faster rates, leading to less sustained ultrafiltration. The reflection coefficient for glucose is approximately 0.3, while icodextrin formulations have values close to 13.
- Osmotic agent used, osmotic concentration, and gradient1: Dextrose at concentrations of 1.5%, 2.5%, and 4.25% (1.36,% 2.27%, and 3.86% anhydrous dextrose, respectively) are commonly used. Another osmotic agents in PD include 7.5% polyglucose (icodextrin) and 1.1% amino acids. The osmotic concentration of the dialysate relative to the blood determines to what extent fluids are exchanged between the PD solution and the blood. A high osmotic concentration in the dialysate creates a high gradient. Dextrose is continuously absorbed during dialysis which reduces the osmotic gradient and leads to a decline in ultrafiltration over time of the dwell. Icodextrin is absorbed at a slower rate than glucose, which allows for sustained ultrafiltration. 1.1% amino acid PD solutions are similar, with respect to UF, to 1.5% dextrose solutions12.
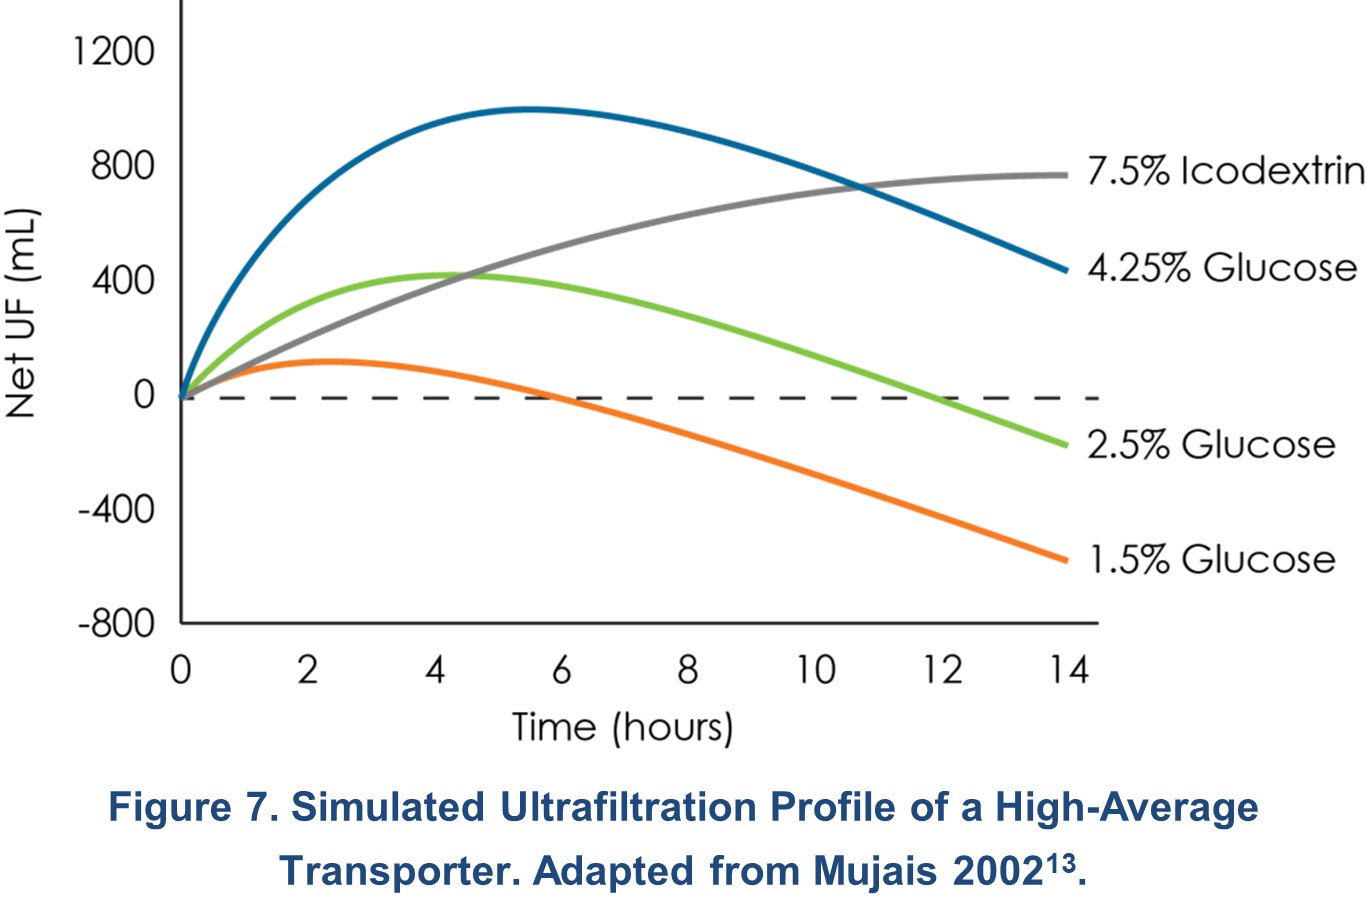 Figure 7 shows a computer simulation of the net ultrafiltration obtained with the use of PD solutions of various dextrose concentrations and with icodextrin over a 14-hour period in a high-average transporter13. Based on this simulation, a single 12-hour 7.5% icodextrin dwell provides around 600 mL of UF. Glucose is more appropriate used for shorter dwell times. With a single 4-hour dwell of 2.5% dextrose, around 400 mL of UF is estimated.
- Effective peritoneal surface area1: The effective peritoneal surface area is determined by the area of the membrane in direct contact with the dialysate and the number of perfused peritoneal capillaries, which varies widely from patient to patient.
- Dwell time: For glucose-based solutions, the osmotic gradient declines over the course of a dwell and the rate dependent on the patient’s transport type. Equilibrium of glucose between the PD solution and plasma is reached faster for high transporters, and slower for low transporters1. For this reason, dwell time should be customized to the patient’s transport type. Generally, peak UF with glucose-based solutions occurs between 2 and 5 hours for high transporters, and 4 to 8 hours for low transporters13. UF with 7.5% icodextrin will continues to increase at a slow rate over much longer dwells13.
- Hydrostatic pressure gradient1: Hydrostatic pressure in a peritoneal capillary is generally around 20 mmHg, which is higher than intraperitoneal pressure (7 mmHg). This pressure difference favors fluid removal. During PD therapy, increases in intraperitoneal pressure from dialysate or body position, for example, reduces the hydrostatic pressure gradient and could reduce ultrafiltration.
Sieving
Sieving is a transport mechanism in which a solute that would normally move with water across a semi-permeable membrane by convection is held back, or “sieved”. Each solute has a sieving coefficient that depends on its molecular weight and charge. A solute’s sieving coefficient can also vary between patients due to variations in pore distributions in the capillary endothelium1. As mentioned earlier, around 50% of ultrafiltration occurs vis the ultra-small pores, specifically through Aquaporin-15. Transport through the ultra-small pores is “free-water transport”, meaning that the water is free of all solutes. In other words, all solutes are sieved at the ultra-small pores. As a result, solutes such as sodium do not move across the membrane in the same proportion as water; this can lead to accumulation of sodium in the body. This effect is called sodium sieving. Sodium sieving occurs during the early phase of PD dwell and is more pronounced with higher glucose-containing PD solutions. In case of sodium, sieving is especially relevant since PD solutions generally have a near physiological sodium concentration that does not create a sufficient diffusive gradient for effective sodium removal1.
Fluid Absorption1
Water and solutes from the dialysate are absorbed by the lymphatic system at a relatively constant rate of 1 – 2 mL/min. Constant fluid absorption during PD limits the duration of a PD dwell since fluid from the peritoneal cavity will be transported into the patient’s body. Lymphatic fluid absorption varies between individuals, but reasons are not well understood.
References:
- Blake PG, Daugirdas JT. Physiology of Peritoneal Dialysis. In: Daugirdas JT, Blake PG, Ing TS, eds. Handbook of Dialysis. 5th ed. Walters Kluwer Health; 2015:392-407.
- Gotloib L. Functional Structure of the Peritoneum as a Dialyzing Membrane. In: Khanna R, Krediet RT, eds. Textbook of Peritoneal Dialysis. 3rd ed. Springer US; 2009:73-135.
- Flessner MF. Peritoneal transport physiology: insights from basic research. J Am Soc Nephrol. 1991;2(2):122-135. Available from: http://www.ncbi.nlm.nih.gov/pubmed/1954325.
- Flessner MF. Solute and water transport across the peritoneal membrane. In: Ronco C, Bellomo R, Kellum JA, eds. Critical Care Nephrology. 2nd ed. Saunders Elsevier; 2009:1472-1478.
- Devuyst O, Rippe B. Water transport across the peritoneal membrane. Kidney Int. 2014;85(4):750-758. Available from: http://www.ncbi.nlm.nih.gov/pubmed/23802191.
- Rippe B, Stelin G. Simulations of peritoneal solute transport during CAPD. Application of two-pore formalism. Kidney Int. 1989;35(5):1234-1244. Available from: http://www.ncbi.nlm.nih.gov/pubmed/2770105.
- Rippe B, Stelin G, Haraldsson B. Computer simulations of peritoneal fluid transport in CAPD. Kidney Int. 1991;40(2):315-325. Available from: http://www.ncbi.nlm.nih.gov/pubmed/1942781.
- Ronco C. The “nearest capillary” hypothesis: a novel approach to peritoneal transport physiology. Perit Dial Int. 1996;16(2):121-125. Available from: http://www.ncbi.nlm.nih.gov/pubmed/9147543.
- Holmes CJ. Abnormalities of Host Defense Mechanisms During Peritoneal Dialysis. In: Nissenson AR, Fine RN, eds. Dialysis Therapy. 3rd ed. Hanley & Belfus; 2002:235-238.
- Krediet RT. The Physiology of Peritoneal Solute, Water, and Lymphatic Transport. In: Khanna R, Krediet R, eds. Textbook of Peritoneal Dialysis. 3rd ed. Springer Science+Business Media; 2009:137-172.
- Fowler S, Roush R, Wise J. Cell Struture and Function. In: Concepts of Biology. OpenStax; 2013.
- Shockley TR, Martis L, Tranaeus AP. New solutions for peritoneal dialysis in adult and pediatric patients. Perit Dial Int. 1999;19 Suppl 2:S429-34. Available from: http://www.ncbi.nlm.nih.gov/pubmed/10406559.
- Mujais S, Vonesh EEF. Profiling of peritoneal ultrafiltration. Kidney Int Suppl. 2002;62(81):S17-S22. Available from: https://www.ncbi.nlm.nih.gov/pubmed/12230478.
P/N 102479-01 Rev B 3/2021