
Measuring Hemodialysis Dose
In medicine, a “dose” refers to the amount of a particular drug that is taken by a patient. However, in dialysis the “dose” is measured by the effect yielded by a certain prescription. More specifically, it refers to the amount of a particular toxic marker that is removed from a patient’s blood. Urea and creatinine are the most common markers used for measuring the adequacy of dialysis dose1. They are measured as surrogate markers for the efficiency of a dialysis treatment to clear the blood of toxins and metabolic end products. By removing an adequate amount of this marker (ie, achieving an adequate dialysis dose), it is possible to reduce morbidity and mortality, control symptoms, and enhance quality of life2.
Many methods have been proposed to measure the dose of dialysis; however, the most frequently used is the Kt/V urea. Urea is a small, water-soluble compound that is formed from the breakdown of amino acids and is dependent on protein intake and breakdown. Many early studies implicated urea as a major body toxin3 and it was originally considered to be a good surrogate marker for other pathogenic solutes4. Urea is currently used to quantify the dose of dialysis due to its abundance in renal failure, ease of measurement, wide volume of distribution, and good dialyzability1,5,6.
The concept behind Kt/V urea arose from a reanalysis of the National Cooperative Dialysis Study (NCDS) by Gotch and Sargent in 19857. The researchers showed that clinical outcomes could be better predicted when the dose of dialysis was expressed as the product of dialyzer urea clearance (K) and treatment time (t), divided by the urea distribution volume (V)3,7–9. The result was an expressionless number that described the volume of urea cleared during a dialysis session relative to the volume of urea distributed throughout the body4 (see below).
(K (mL/min) × t (min))/V(mL)
Assuming no ultrafiltration or urea generation, the delivered Kt/V urea can be calculated from the urea concentration at the start and end of dialysis using the formula below1. In the equation, ln stands for the natural logarithm, C0 is the initial urea concentration, and Ct is the ending urea concentration.
Kt/V = ln(C0/Ct )
Unfortunately, such a simple equation cannot account for other factors that may affect the delivered dose of dialysis1,10. The final concentration of urea not only depends on urea removal by the dialyzer, but also on urea generation (G) and the convective effects of ultrafiltration. Similarly, the volume of distribution for urea (V) is not fixed and will vary according to intradialytic water removal. As such, urea kinetic modeling (UKM) (sometimes called formal UKM) was developed as a more accurate method for determining Kt/V1,3,10–12. These models simulate the movement of urea during the dialysis session and derive values for V and G to calculate the dialysis dose1,11,12 (see Table 1). Thus, these equations can account for the confounding effects of ultrafiltration as well as urea generation10,12.
Table 1
| Variables Estimated Using Urea Kinetic Modeling (UKM) | |
| Variable | Explanation |
| V | Volume of distribution of urea, which equates closely to body water |
| G | Urea generation rate during dialysis |
| PCRn | Normalized protein catabolic rate, which is estimated from G; in stable patients PCRn equals dietary protein |
| K | Dialyzer clearance extrapolated from the dialyzer mass transfer area coefficient (KoA) |
| Table adapted from reference11 | |
UKM is currently the preferred method for determining Kt/V by the National Kidney Foundation KDOQI Guidelines5 and was used in the NCDS reanalysis discussed above7. Several different UKMs have been developed to quantify Kt/V, including the single pool Kt/V, equilibrated Kt/V, and weekly standard Kt/V.
Single-Pool Kt/V (spKt/V)
The most common model for calculating Kt/V is based on the assumption that urea is located in only one compartment (or pool) of the body4,10,13. This idea of a single-pool Kt/V (spKt/V), predicts a linear decline in urea and an immediate equilibration between the blood and tissue compartments after dialysis. Thus, the spKt/V is calculated through measurement of the pre-dialysis BUN concentration, followed by the post-dialysis BUN concentration 10-15 seconds after the end of dialysis5,8. The lag-time is used to account for the confounding effects of blood recirculation within the fistula8,12. The current KDOQI guidelines on hemodialysis adequacy recommend that the minimally adequate dose for conventional, thrice-weekly treatment be a spKt/V of 1.2, with a target dose of 1.45.
The equation below is an example of a simplified, second generation logarithmic UKM formula used to calculate spKt/V, where ln is the natural logarithm, R is the post-dialysis/pre-dialysis serum urea ratio, t is the treatment time (in hours), UF is ultrafiltration volume (in liters), and W is the patient’s post-dialysis body weight (in kilograms)4,14. However, it should be noted that this equation is only accurate when applied to dialysis given thrice-weekly for 2.5-5 hours5.
Equilibrated Kt/V (eKt/V)
Unlike spKt/V, the equilibrated Kt/V (eKt/V) recognizes that urea is not confined to one compartment of the body. Although the blood urea concentration is low at the end of a dialysis session, urea will eventually diffuse out of the cells and back into the extracellular space. In fact, the full equilibration of urea between the blood and tissue compartments is not complete until 30-60 minutes after the end of dialysis4,8. The difference between the blood urea concentration at the end of dialysis and the concentration after full equilibration is referred to as “urea rebound”. Since spKt/V models do not account for this rebound effect, they are likely to overestimate the amount of dialysis received by the patient8,10,12. Thus, the eKt/V (sometimes called double-pool Kt/V) was developed to account for the effects of urea rebound and more accurately reflect the delivered dose of dialysis.
Fortunately, patients do not need to remain in-center for an extra 30-60 minutes while the urea equilibrates. Rebound can be predicted from a non-equilibrated post-dialysis serum urea concentration and the spKt/V, as shown below8,10. Please note that the equation changes depending on whether the patient is dialyzing using an arterial-venous access (eg, AV fistula) or strictly venous access (eg, CV catheter).
Arterial Access: eKt/V=spKt/V- (0.6×spK/V)+0.03
Venous Access: eKt/V=spKt/V- (0.47×spK/V)+0.02
Weekly Standard Kt/V (stdKt/V)
Interest in more frequent hemodialysis has prompted the creation of a weekly standard Kt/V (stdKt/V)15. Unlike spKt/V and eKt/V, which describe the effect of single session of intermittent treatment, the stdKt/V provides treatment information for a broad spectrum of dialytic therapies, including variable frequency hemodialysis (two to seven sessions per week), continuous and intermittent peritoneal dialysis, and continuous renal replacement therapies for acute renal failure. As such, urea kinetic modeling with stdKt/V can be useful for comparing different treatment regimens and modalities4,8,16.
Development of a stdKt/V was necessary since the single pool and equivalent Kt/V calculations, which are measured by taking the pre- and post-dialysis urea concentrations, do not accurately reflect the dose of more frequent HD regimens. These original models are inaccurate because the total urea mass removed per unit time decreases as the dialysis treatment time increases (ie, not as much urea is removed as the dose increases). Thus, a new model—the stdKt/V—was needed to accurately reflect the dialysis dose being provided. In determining stdKt/V, urea clearance, urea generation and blood urea concentration are calculated over a period of one week and normalized to body water (or rather, the total volume of distribution of urea). A minimum stdKt/V of 2.0 per week is recommended for all patients by the KDOQI guidelines and is roughly equivalent to the weekly dose of three single dialysis treatments with a spKt/V of 1.2 each5. We can see from Figure 1 that the spKt/V of the dialysis sessions per week cannot just be added to determine the weekly dose; a specific stdKt/V formula has to be used.
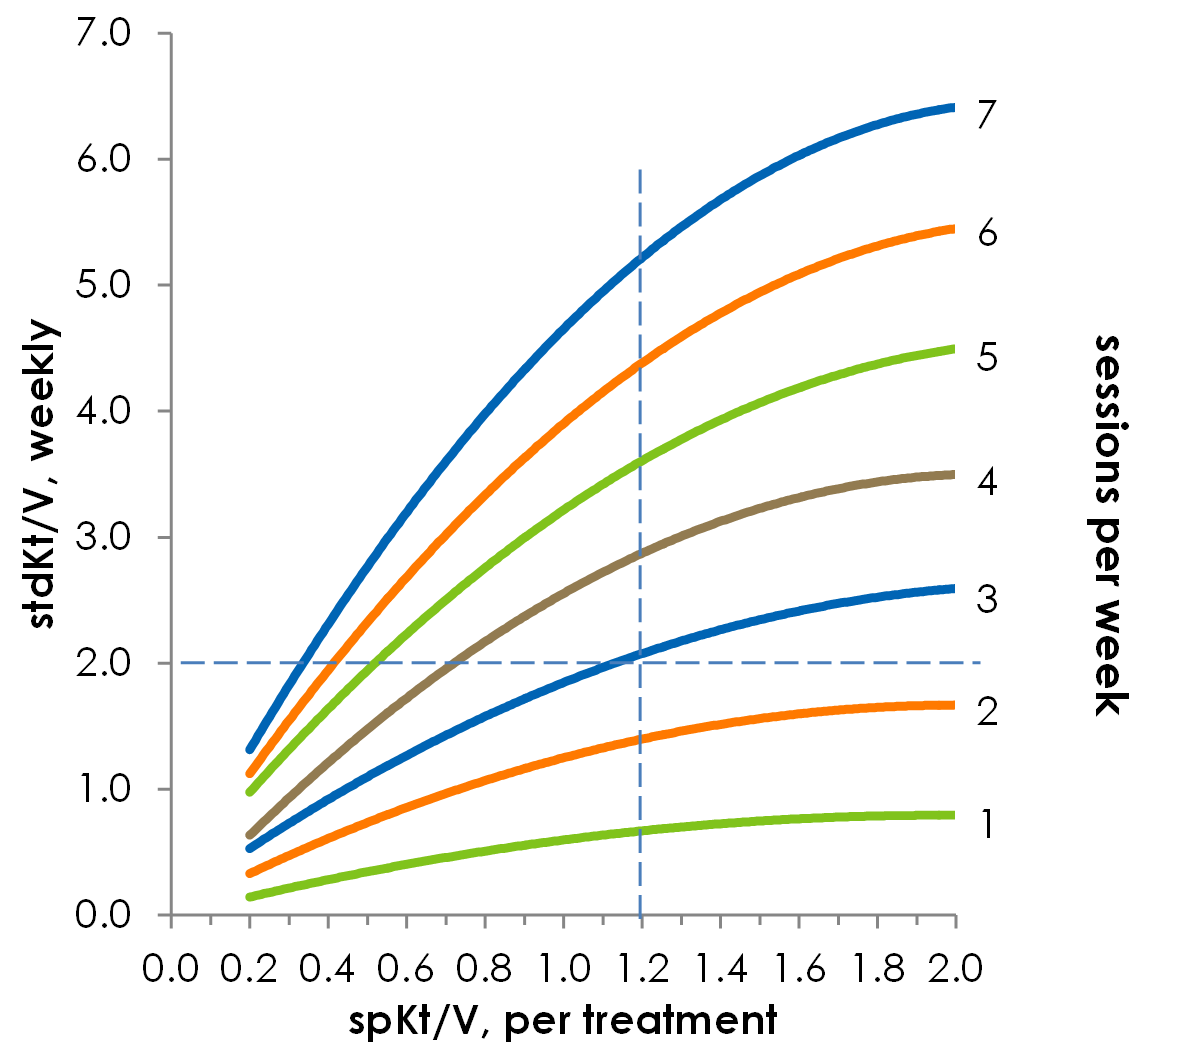
Figure 1. The relationship between spKt/V and stdKt/V is not linear. For a standard session length of 3.5 hours, you can see that in order to achieve a weekly stdKt/V of 2.0, dialyzing three times per week required a spKt/V of 1.2. Based on reference21
Urea Reduction Ratio (URR)
Due to the complexity of UKM, the urea reduction ratio (URR) was proposed as a simpler alternative to measure dialysis dose. The URR, which is expressed as a percentage, refers to the reduction in serum urea concentration during dialysis treatment and is mathematically related to spKt/V, as shown below8. In the equations, Ct and Co represent the post-dialysis and pre-dialysis serum urea concentrations, respectively.
![]()
![]()
The URR correlates well with dialysis outcomes, and is recognized by the KDOQI guidelines as an acceptable method to quantify the dialysis dose. However, unlike UKM significant variability may occur because the URR does not take into account intradialytic urea generation or ultrafiltration4,5. In order to provide adequate clearance, the KDOQI guidelines recommend that conventional trice weekly hemodialysis treatments less than 5 hours should have a minimum URR of 65% with a target dose of 70%5.
Impact of Residual Urea Clearance (KR)
Previous studies have shown that a patient’s native residual urea clearance (KR) can markedly decrease the need for dialysis and have an important influence on mortality17. Although the magnitude of this clearance is seemingly small, KR is a continuous process that serves to attenuate the rise of toxins between dialysis treatments5,10. Many practicing nephrologists do not compensate for residual function when calculating the hemodialysis dose due to the inconvenience and cost of measurements. More importantly, such practices may also have a negative psychological impact, as patients would continually see their dialysis dose increase as their disease progresses and native kidney function is lost10. However, several methods are available to incorporate KR into the hemodialyzer clearance. These methods are discussed in detail in the most recent KDOQI guidelines, and are beyond the scope of this review5. In contrast to hemodialysis, measurements of peritoneal dialysis dose usually consider RRF as part of the adequate solute removal.
Other Markers of Dialysis Dose
Although urea is the most common marker used to quantify the dose of dialysis, urea is not closely correlated with the removal of larger water-soluble compounds, protein-bound solutes, or middle molecules4,6. As such, other molecules such as β2-microglobumin18, cystatin-C19, and phosphate20 have been investigated as markers of dialysis dose.
References:
- Locatelli F, Buoncristiani U, Canaud B, Köhler H, Petitclerc T, Zucchelli P. Dialysis dose and frequency. Nephrol Dial Transplant. 2005;20(2):285-296. Available from: http://www.ncbi.nlm.nih.gov/pubmed/15598667.
- Sehgal AR, Leon JB, Siminoff LA, Singer ME, Bunosky LM, Cebul RD. Improving the Quality of Hemodialysis TreatmentA Community-Based Randomized Controlled Trial to Overcome Patient-Specific Barriers. JAMA. 2002;287(15):1961-1967. Available from: https://doi.org/10.1001/jama.287.15.1961.
- Gotch FA. Kt/V is the best dialysis dose parameter. Blood Purif. 2000;18(4):276-285. Available from: http://www.ncbi.nlm.nih.gov/pubmed/10965068.
- Kuhlman MK, Kotanko P, Levin NW, Kuhlmann MK, Kotanko P, Levine NW. Hemodialysis: Outcomes and Adequacy. In: Floege J, Johnson RJ, Feehally J, eds. Comprehensive Clinical Nephrology. 4th ed. Elsevier Saunders; 2010:1060-1068. Available from: http://www.us.elsevierhealth.com/nephrology/comprehensive-clinical-nephrology-expert-consult/9780323058766/.
- KDOQI. Clinical practice guidelines and clinical practice recommendations for 2006 updates: hemodialysis adequacy, peritoneal dialysis adequacy and vascular access. Am J Kidney Dis. 2006;48(48):S1-S322. Available from: http://www.kidney.org/PROFESSIONALS/kdoqi/guideline_upHD_PD_VA/index.htm.
- Depner TA. Uremic toxicity: urea and beyond. Semin Dial. 2001;14(4):246-251. Available from: http://www.ncbi.nlm.nih.gov/pubmed/11489197.
- Gotch F, Sargent J. A mechanistic analysis of the National Cooperative Dialysis Study (NCDS). Kidney Int. 1985;28(3):526-534. Available from: http://www.ncbi.nlm.nih.gov/pubmed/3934452.
- Kotanko P, Levin NW, Gotch FA. Dialysis Delivery and Adequacy. In: Molony DA, Craig JC, eds. Evidenced Based Nephrology. Blackwell Publishing Ltd; 2009:423-430.
- Gotch FA, Sargent JA, Keen ML. Whither goest Kt/V? Kidney Int Suppl. 2000;76:S3-18. Available from: http://www.ncbi.nlm.nih.gov/pubmed/10936795.
- Depner TA. Chapter 6: Approach to Hemodialysis Kinetic Modeling. In: Henrich WL, ed. Principles and Practice of Dialysis. 4th ed. Lippincott Williams & Wilkins; 2009:73-92.
- O’Connor AS, Wish JB. Chapter 8: Hemodialysis Adequacy and the Timing of Dialysis Initiation. In: Henrich WL, ed. Principles and Practice of Dialysis. 4th ed. Lippincott Williams & Wilkins; 2009:106-122.
- Kemp HJ, Parnham A, Tomson CR. Urea kinetic modelling: a measure of dialysis adequacy. Ann Clin Biochem. 2001;38(Pt 1):20-27. Available from: http://www.ncbi.nlm.nih.gov/pubmed/11270837.
- Gotch FA. Evolution of the single-pool urea kinetic model. Semin Dial. 2001;14(4):252-256. Available from: http://www.ncbi.nlm.nih.gov/pubmed/11489198.
- Daugirdas JTT. Second generation logarithmic estimates of single-pool variable volume Kt/V: an analysis of error. J Am Soc Nephrol. 1993;4(5):1205-1213. Available from: http://www.ncbi.nlm.nih.gov/pubmed/8305648.
- Diaz-Buxo JA, Loredo JP. Standard Kt/V: comparison of calculation methods. Artif Organs. 2006;30(3):178-185. Available from: http://www.ncbi.nlm.nih.gov/pubmed/16480392.
- Meyer TW, Sirich TL, Hostetter TH. Dialysis cannot be dosed. Semin Dial. 2011;24(5):471-479. Available from: http://www.pubmedcentral.nih.gov/articlerender.fcgi?artid=4124940&tool=pmcentrez&rendertype=abstract.
- Termorshuizen F, Dekker FFW, van Manen JGJ, et al. Relative contribution of residual renal function and different measures of adequacy to survival in hemodialysis patients: an analysis of the Netherlands Cooperative Study on the Adequacy of Dialysis (NECOSAD)-2. J Am Soc Nephrol. 2004;15(4):1061-1070. Available from: http://www.ncbi.nlm.nih.gov/pubmed/15034110.
- Baurmeister U, Vienken J, Ward R a. Should dialysis modalities be designed to remove specific uremic toxins? Semin Dial. 2009;22(4):454-457. Available from: http://www.ncbi.nlm.nih.gov/pubmed/19709001.
- Huang S-HS, Filler G, Yasin A, Lindsay RM. Cystatin C reduction ratio depends on normalized blood liters processed and fluid removal during hemodialysis. Clin J Am Soc Nephrol. 2011;6(2):319-325. Available from: http://www.pubmedcentral.nih.gov/articlerender.fcgi?artid=3052222&tool=pmcentrez&rendertype=abstract.
- Schmitt CP, Borzych D, Nau B, Wühl E, Zurowska A, Schaefer F. Dialytic phosphate removal: a modifiable measure of dialysis efficacy in automated peritoneal dialysis. Perit Dial Int. 2009;29(4):465-471. Available from: http://www.ncbi.nlm.nih.gov/pubmed/19602613.
- Gotch FA. The current place of urea kinetic modelling with respect to different dialysis modalities. Nephrol Dial Transplant. 1998;13 Suppl 6:10-14. Available from: http://www.ncbi.nlm.nih.gov/pubmed/9719197.
P/N 102476-01 Rev C 02/2021