
Time and Process Dependent Number Series
Frequently in clinical and experimental medicine we measure the same parameter repeatedly over an interval of time to detect the time course of a disease or a treatment intervention. The ways in which a parameter value may change over time or in response to a quantifiable process are numerous. We are only likely to be interested in the behavior of the parameter if it is other than random.
The fall in serum cholesterol in response to drug therapy is likely to be linear over time reaching a lower value at which it stabilizes. The fall in urea in response to dialysis treatment is not linear but exponential, whereas the rise in urea between two dialysis sessions is effectively linear. The example above of rising creatinine as chronic renal failure or CRF progresses is obviously not linear and is, in fact, exponential. The relationship between blood urea and risk of mortality in dialysis patients is U shaped – i.e., the risk of death is higher for both very high values and for very low values.
We need often to mathematically quantify such relationships if we are to understand the underlying mechanisms, to make predictions or to create models of parameter behavior. Statistical mathematics such as linear and non-linear regression and logistic regression are important tools for the study of such varied responses of parameters to disease and therapy.
Examples of time and process dependent number series
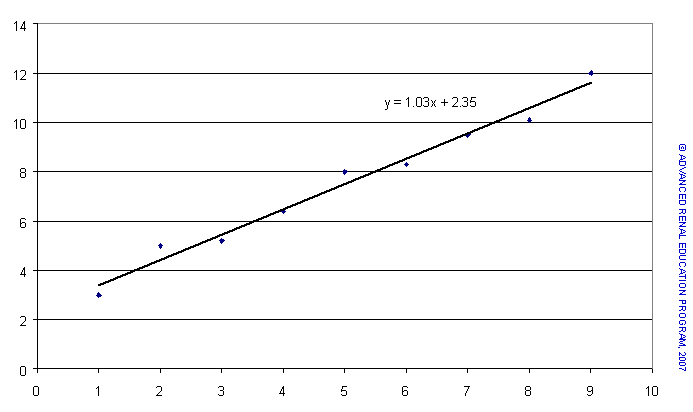
Linear Series
The first example shows a rise in value of the dependent variable in response to each unit of time or of process. This would be typical of the rise in solute concentration in response to a metabolic process. The exact values of the dependent variable do not fall precisely in a straight line but a mathematical process (called least squares) can provide a line that is the best (most probable) linear “fit” for the data points. In turn, this line has a unique equation (in this case dependent variable (y) = 1.03*time or process + 2.35; y = 1.03x+2.35). This equation tells us that for every rise in one unit of the independent variable (x, e.g., time in hours) the dependent variable (y) will rise by 1.03 units. This equation has the general form y=bx+a: if b is positive, y rises with rise in x; if b is negative y falls with rise in x. In this equation 2.35 is the value of y when x is zero.
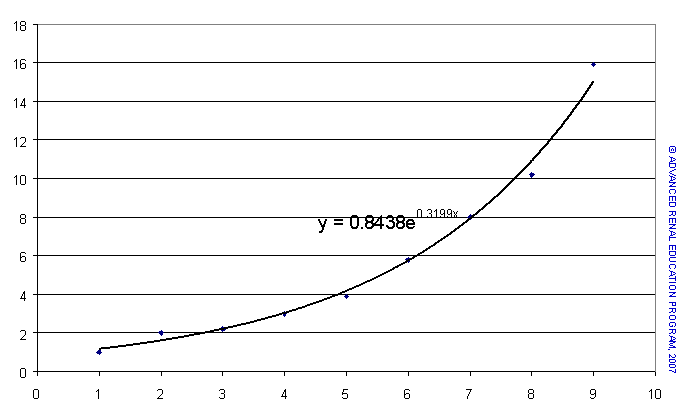
Exponential Series
In the second example we see a series of points that do not form a straight line but rather a curve that is concave upwards. Trying to fit a straight line through these points would have no meaning. Again, mathematics provides a means of providing a curve that is the best “fit” for these points and, again, this line has a unique equation. The form of this equation is quite different to that for the linear relationship in the first example; y = 0.84*e(exponent)0.32x. In words, this equation tells us that the value of y rises cumulatively by 32% (0.32) for each rise of one unit in the value of x from a starting value of 0.84 when x = 0. The notation “e” is the mathematical exponent function. This equation has the general form y = a * ebx; again, positive values of b indicate exponential rise in y for rise in x and negative values of b indicate exponential fall in y for rise in x.
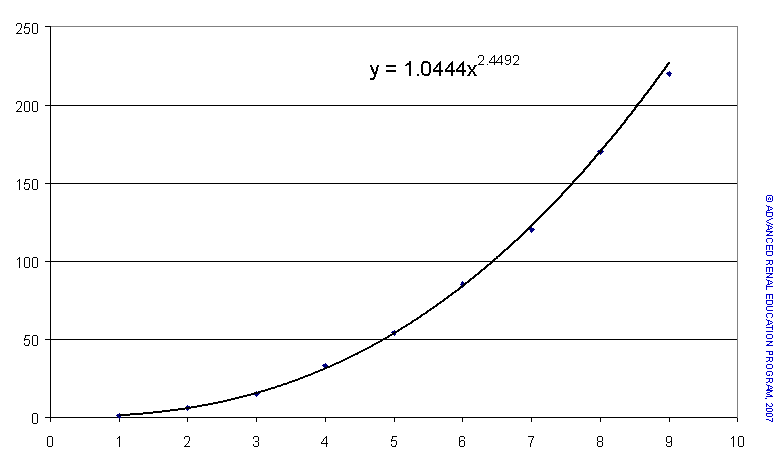
Power Series
The third example is again a non-linear relationship but quite different to the exponential example. In this case the rise in y is a function of x raised to some power. Mathematics fit a unique line to the data points which has the general form y = a * xb. For this example y = 1.04×2.45; this translates as for every unit rise in x, y rises by x raised to the power 2.45.
Far more complex relationships between data series and time or process values are possible and can, to a greater or lesser degree, be mathematically defined. Data resulting from clinical measurement or from experiment which can be related to time or to a quantifiable process can be plotted on charts to view what sort of mathematical relationship is most appropriate. Depending on the form of the data relationship, computer programs can be used to test different “best fits” (linear and non-linear) for the data. It is then possible using statistical methods to determine the goodness of fit of a chosen equation.
P/N 101823-01 Rev B 02/2021